Category Archives: data and design

The Story of Hybrid Insights: Skunkworks in the Attic

(Day 2 of 5 Days, 5 Themes)

“Yeah, I’ve taught survey design.”
“You have? Want to help?”

With that, Johannes and I joined forces on an informal, internal project at IDEO; our goal was to integrate quantitative research methods into the traditionally qualitative landscape of work that the firm is known for. While we saw the tremendous benefit that clients were getting from ethnographic research, we wanted to do more. We started by building smarter surveys.

Surveys aren’t often thought of as a way to inspire design. They are generally pretty dry and written in a kind of robotic language that is appealing to a researcher seeking scientific rigor, but their disconnection with the real person responding to questions means that that person is likely not really paying attention or being thoughtful with their responses.

Surveys also usually focus on opinions and demographics, which are useful for some purposes, but those kinds of responses don’t usually help uncover opportunities for developing new kinds of products or services. We don’t know what people really want or need if we only know what they like and where they live. By asking smarter questions about people’s behaviors, attitudes, and needs, we are able to uncover places to develop truly useful new offerings. Also, by learning from hundreds or thousands of people at a time, our design teams and our clients can all feel more confident about what we’re learning.

As our research approach solidified, our team grew to four. We sequestered a weird attic space at our Palo Alto studio as our headquarters, and set to work codifying our research approach, which had been dubbed Hybrid Insights. We worked in the moments between projects, after work, and on weekends.


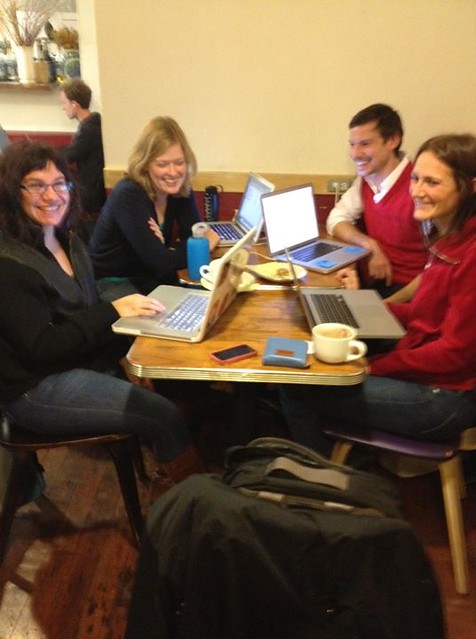
The team, hunkered down in a coffee shop in San Francisco, on a Sunday afternoon. From left to right: Alisa Lemberg, Juliette Melton, Johannes Seemann, Silvia Vergani.

Three years later, Hybrid Insights is a core component of many of the projects we do at IDEO. Hybrid projects have happened or are starting in our San Francisco, Palo Alto, Boston, Chicago, Singapore, and Munich studios. Our core team is growing, and our network of collaborators spans the globe.

At IDEO we help our clients innovate; this experience of helping IDEO itself innovate has been remarkable. Whether you call it a lab, or skunkworks, I’ve learned how supporting a small group of people with a vision can yield enormous benefits for organizations and individuals.

Read more about our approach here: Hybrid Insights: Where the Quantitative Meets the Qualitative Rotman Magazine, 2012

Learning to Love Data

To kick off my 5 Days, 5 Themes project, I’ll start with a guiding principle that has shaped my work over the past years.

Whether or not we have the confidence or the pedigree to do so, we all owe it to ourselves (and each other) to get comfortable working with data.

I don’t mean we all need to go back to school to earn degrees in data science. I do mean that if more people had some basic understanding of the process of measuring the world and an awareness of how meaning is derived from those measurements the world would be a little better.

Here’s what I mean: when non-data scientists get involved in the world of numbers, they are able to make their own work richer, because they can tap into new veins of insights. I learned this when I first started working with web analytics many years ago. Just seeing the charts depicting people’s behaviors — the most elementary sort of web analysis — made the conversations I was having with individual community members more meaningful. I began to understand how one person’s story could illuminate the actions of many others, and I could talk to people in person to understand more about the trends I was seeing in the visitor data. For me, it was like how learning another language made travel more enjoyable, allowing me to understand and integrate concepts that otherwise would have been outside my grasp.

Caring about data extends beyond the work we do into the role of data in our lives. That could mean taking a more active stance around such issues as surveillance and net neutrality, or it could mean that you develop an interest in understanding how ad targeting works so that you can choose how much information advertisers have about you. Helping more people be active participants in our increasingly monitored world has the potential to significantly change how organizations and governments collect data and make decisions based off of it.

For inspiration on data literacy and advocacy, two organizations to watch are Data & Society Research Institute and DataKind.

Tune in tomorrow for The Story of Hybrid Insights to learn more about how I’ve learned to love data and how I’ve helped other people love it, too.

Showing My Work: 5 Days, 5 Themes

This week I’m trying something new; I love talking about what I’m working on, but I don’t write much about it, and it’s time for that to change. As an experiment, this week I’ll be posting five short pieces about five different themes of my work. In future posts I’ll go into more depth.

My kick in the pants to do this began when I saw this tweet from my indomitable friend Diana Kimball.

I bought Austin’s book, and finally had a chance to read it (in a similarly big gulp) on a long flight home to San Francisco yesterday. Crammed into an economy seat, I tapped out many pages of writing on my tiny iPad keyboard, inspired and ready to start sharing.

Monday: Learning to Love Data
Tuesday: The Story of Hybrid Insights: Skunkworks in the Attic
Wednesday: Learn More: Synthesis is the New Analysis
Thursday: The Most Useful Ways That People are the Same: Better Segmentation
Friday: It’s Simple, But Not Easy